Central and Eastern Asia Hidden in the Light
“At least when it comes to light pollution what happens in Vegas does not stay in Vegas” – Paul Bogard
Overview
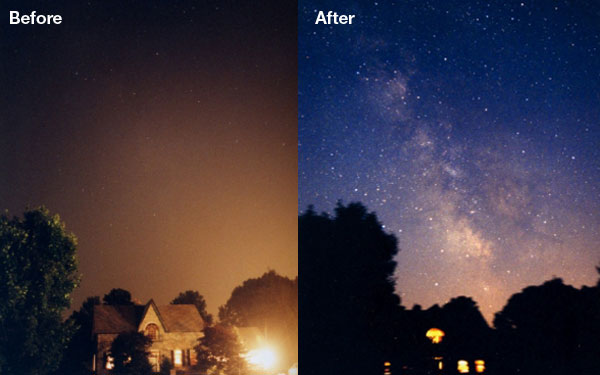
The ability to see the stars is becoming more of a luxury every single year. Light pollution has obstructed the sky in populated areas and people make trips to isolated locations just to get a chance to have a clear view of the sky. The bright signs we install to advertise supermarkets and unshielded light fixtures brightening up our roads contribute heavily to light pollution. The results are astounding and, for most people brought up in this generation, hard to believe. The picture below is a before and after picture during the Northeast blackout of 2003. During the Northeast blackout of 2003, more than 50 million people in the US and Canada lost power and the results are crystal clear:

Results of 2003 Northeast blackout
Over the past 10 years, there has been a surge in the technology industry in Central and Eastern Asia that has been extremely beneficial to their economies. However, this means that towns are turning into cities and areas that used to be dark are now shining their lights into the sky.
Indoor bright lights don’t have much of an effect on light pollution but lights exposed to the sky do mask the sky and can actually be detected by satellites, as shown in the animation above.
Data Description
The animation above uses the Visible Infrared Imaging Radiometer Suite (VIIRS1) Day/Night Band to create this visualization of nighttime lights. This data is collected via the Defense Meterological Satellite Program. This data looks at incoming light from Earth during nighttime. The lights are filtered to account for clouds, stray lights, fire, etc. and the higher the density and brightness of the light observed, the more white a pixel is in the visualization above. The units for the pixel values is nanoWatts/cm2/sr.
The rasters come from Earth Observing Group, NOAA National Centers for Environmental Information (NCEI) in the GeoTIFF format2. The data downloaded included January and July data from 2013 to 2018. In order to produce annual data, the January and July rasters were averaged using the below script produced in Python3 and new annual rasters were exported in the same GeoTiff format. The script must be run in the OSGeo4W Shell4 to use the gdal package.
The visualization was created in ArcGIS Pro using the Animation tool and was exported in the MPEG-45 format.
# This script averages pairs of monthly GeoTIFF rasters to create annual rasters. The input requires .tif files with names
# changed to the names listed in the file arrays below.
#
# Author: Pulak Raj
#
# Last edit: 05/05/20

# Required modules
import gdal

# Input files
january_files = ["Asia_2013_1.tif", "Asia_2014_1.tif", "Asia_2015_1.tif",
                 "Asia_2016_1.tif", "Asia_2017_1.tif", "Asia_2018_1.tif"]
july_files = ["Asia_2013_7.tif", "Asia_2014_7.tif", "Asia_2015_7.tif",
              "Asia_2016_7.tif", "Asia_2017_7.tif", "Asia_2018_7.tif"]

#Output files
new_files = ["Asia_2013.tif", "Asia_2014.tif", "Asia_2015.tif",
             "Asia_2016.tif", "Asia_2017.tif", "Asia_2018.tif"]

for i in range(0, 6):
    # Extracts January Arrays
    tiff_file = gdal.Open(january_files[i])

    geotransform = tiff_file.GetGeoTransform()
    projection = tiff_file.GetProjection()
    band = tiff_file.GetRasterBand(1)
    xsize = band.XSize
    ysize = band.YSize
    array = band.ReadAsArray()

    tiff_file = None
    band = None

    # Extracts July Arrays
    tiff_file_2 = gdal.Open(july_files[i])

    band_2 = tiff_file_2.GetRasterBand(1)
    array_2 = band_2.ReadAsArray()

    tiff_file_2 = None #close it
    band_2 = None #close it

    # Computes average of array values
    new_array = (array + array_2) / 2

    # New tif file
    driver = gdal.GetDriverByName('GTiff')
    new_tiff = driver.Create(new_files[i],xsize,ysize,1,gdal.GDT_Int16)
    new_tiff.SetGeoTransform(geotransform)
    new_tiff.SetProjection(projection)
    new_tiff.GetRasterBand(1).WriteArray(new_array)
    new_tiff.FlushCache()
    new_tiff = None
Author: Pulak Raj. Last edited: 2020-05-05.
About VIIRS. NASA.gov. Accessed 2020-5-5. Online: https://ladsweb.modaps.eosdis.nasa.gov/missions-and-measurements/viirs/↩︎
Geostationary Earth Orbit Tagged Image File Format. Accessed 2020-05-05. Online: https://earthdata.nasa.gov/esdis/eso/standards-and-references/geotiff↩︎
Python. Copyright (C) 2001–2020. Python Software Foundation. Accessed 2020-05-05. Online: https://www.python.org/↩︎
OSGeo41. Open Source Geospatial Foundation Licenses. Accessed 2020-05-05. Online: https://www.osgeo.org/about/licenses/↩︎
Moving Picture Experts Group Standard 4 (MPEG-4). Standard developed by a working group of the International Organization for Standardization (ISO) and the International Electrotechnical Commission (IEC) joint technical committee. Accessed 2020-05-05. Online: https://mpeg.chiariglione.org/↩︎